Analytics and Reporting
The Live Carts for WooCommerce plugin provides detailed analytics through WooCommerce's native analytics system, offering insights into cart behavior, conversion patterns, and customer journey analysis.
Table of Contents
- Accessing Analytics
- Understanding Key Metrics
- Reading Cart Reports
- Analytics Dashboard
- Data Interpretation
Accessing Analytics
How to Access Cart Analytics
The plugin integrates directly with WooCommerce Analytics:
- Primary Path: Go to WooCommerce > Live Carts > Analytics in your WooCommerce admin
- Reports Section: Dedicated cart analytics with detailed breakdowns
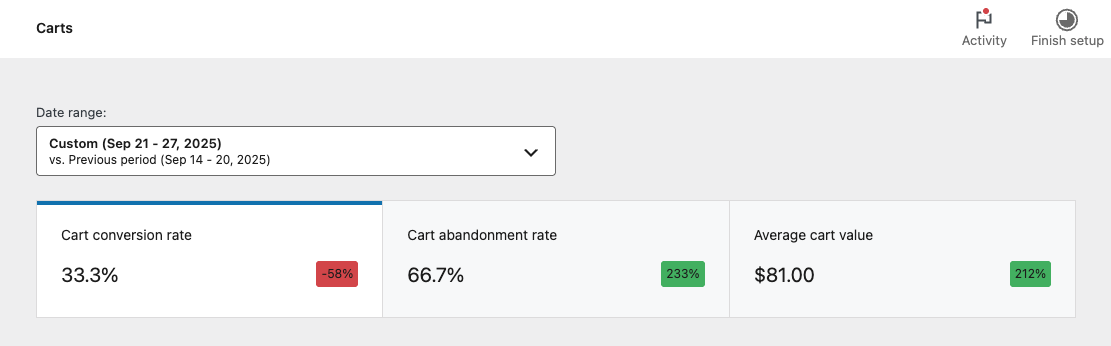
Available Date Ranges
- Predefined Ranges: Today, Yesterday, Last 7 days, Last 30 days, This month, Last month
- Custom Ranges: Select any date range using the date picker
- Comparison Mode: Compare current period with previous period to see trends
- Real-time Updates: Data refreshes automatically as new cart activity occurs
Understanding Key Metrics
Cart Conversion Rate
What it means: Percentage of created carts that result in completed orders
How to read it:
- High Rate (>30%): Excellent checkout experience, customers are completing purchases
- Average Rate (15-30%): Standard e-commerce performance
- Low Rate (<15%): May indicate checkout issues or pricing concerns
What affects it: Checkout process complexity, shipping costs, payment options, website speed
Cart Abandonment Rate
What it means: Percentage of carts that are abandoned without completing purchase
Industry Benchmarks:
- Retail Average: 60-70%
- Good Performance: <50%
- Needs Attention: >80%
Common reasons: Unexpected shipping costs, required account creation, complicated checkout, security concerns
Average Cart Value
What it means: Average monetary value of all tracked carts
How to interpret trends:
- Increasing: Successful upselling, premium product adoption
- Decreasing: Price sensitivity, competitive pressure
- Seasonal patterns: Normal for many businesses
Cart Lifetime
What it means: Time from cart creation to conversion or abandonment
Key insights:
- Quick conversions: Impulse purchases, clear buying intent
- Delayed conversions: Research-heavy purchases, comparison shopping
- Peak abandonment times: Identify when customers typically give up
Reading Cart Reports
Cart Status Overview
The main analytics dashboard shows cart distribution:
- Active Carts: Currently being used by customers
- Abandoned Carts: No activity for over 2 hours (configurable)
- Converted Carts: Successfully completed as orders
Performance Charts
Conversion Rates View how your conversion rate changes over time to identify: (Coming Soon)
- Daily patterns (which days perform better)
- Weekly trends (seasonal effects)
- Impact of marketing campaigns or site changes
Cart Value Distribution See the spread of cart values to understand:
- Most common purchase amounts
- High-value cart patterns
- Price sensitivity indicators
Cart Details View
Click on any cart in the analytics to see:
- Products Added: What items customers are interested in
- Time Spent: How long customers take to decide
- Cart Journey: Pages visited before and after adding items
- Abandonment Point: Where in the process customers typically leave
Analytics Dashboard
Filtering and Segmentation
Date Range Filters
- Compare different time periods
- Identify seasonal patterns
- Measure campaign effectiveness
Status Filters
- Focus on specific cart types
- Analyze abandonment patterns
- Track conversion improvements
Value Filters
- High-value cart analysis
- Price sensitivity studies
- Revenue opportunity identification
Data Interpretation
Reading the Numbers
Context is Key Always consider external factors when analyzing data:
- Seasonal shopping patterns
- Marketing campaign timing
- Website changes or updates
- Competitor actions
- Economic factors
Focus on Trends Look for patterns rather than isolated numbers:
- Week-over-week improvements
- Month-over-month growth
- Year-over-year comparisons
- Before/after campaign analysis
Actionable Insights
High Abandonment Rates
- Review checkout process complexity
- Check shipping cost transparency
- Analyze page load speeds
- Test different payment options
Low Conversion Rates
- Examine product page information
- Review customer reviews and ratings
- Check mobile experience
- Analyze pricing competitiveness
Cart Value Trends
- Identify upselling opportunities
- Review product recommendations
- Analyze bundle effectiveness
- Check promotional impact
Next Steps: Review Configuration to customize analytics settings, or check Troubleshooting if you're experiencing data collection issues.