If you run a WooCommerce store, you probably keep a close eye on your order statistics. They are like the pulse of your business, a key indicator of its health. Past ordering trends can help guide future decisions on inventory stocking, marketing campaigns, and product catalog changes.
But your orders only show your customers who made it all the way to checkout. At least as important is understanding the customers who expressed interest in your products but didn’t follow through. The ones who added something to their cart, browsed other products, and then disappeared. This is where the real insight lives, and it’s exactly why we built tools to uncover it.
Our free Live Carts plugin collects and tracks everything that happens in your store’s carts, including details, contents, and changes in real time. Pair it with our free Ninjalytics reporting solution, and you have a genuinely powerful cart analytics setup. It also gives you deeper insight into your full WooCommerce analytics, providing a deeper view of order trends, revenue patterns, and overall store performance. Here’s what you can do with it.
Tracking Outcomes: Conversion and Abandonment Rate
One of the most fundamental cart metrics is conversion rate (and its inverse, abandonment rate).
Here is how to visualize it in Ninjalytics:
- Open your Live Carts Report in Ninjalytics (go to Ninjalytics → Reports and click into the Live Carts Report).
- Expand the Segmentation panel on the right.
- Check Enable Custom Segments and select Cart → Status as your segment.
- Expand the Chart panel and select Bar Chart as the chart type. Set Cart → Status as the series field.
- Click Save or refresh the report.
You’ll now have a snapshot of abandoned carts versus converted ones, providing a visual representation of money left on the table versus money in your pocket.
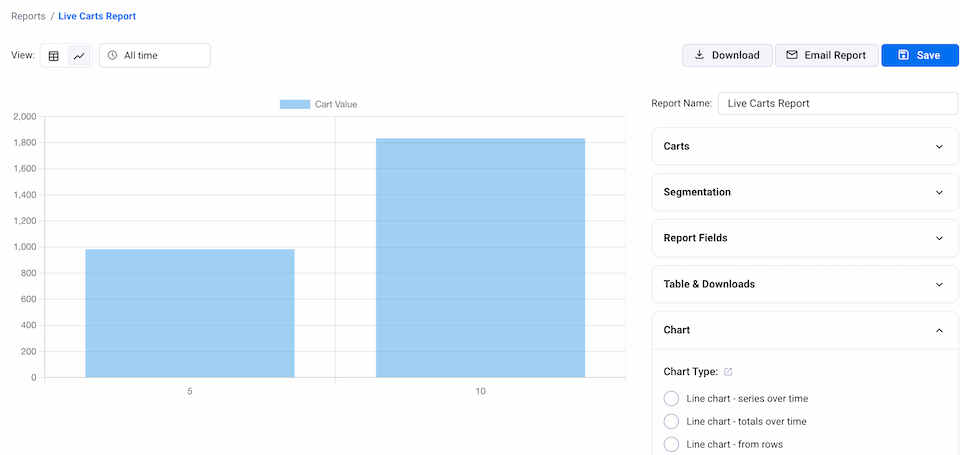
Want to see how those ratios trend over time? Switch the chart type to Line chart – series over time. This is useful if you’re actively working to improve the shopping and checkout experience and want to see whether your changes are making a difference.
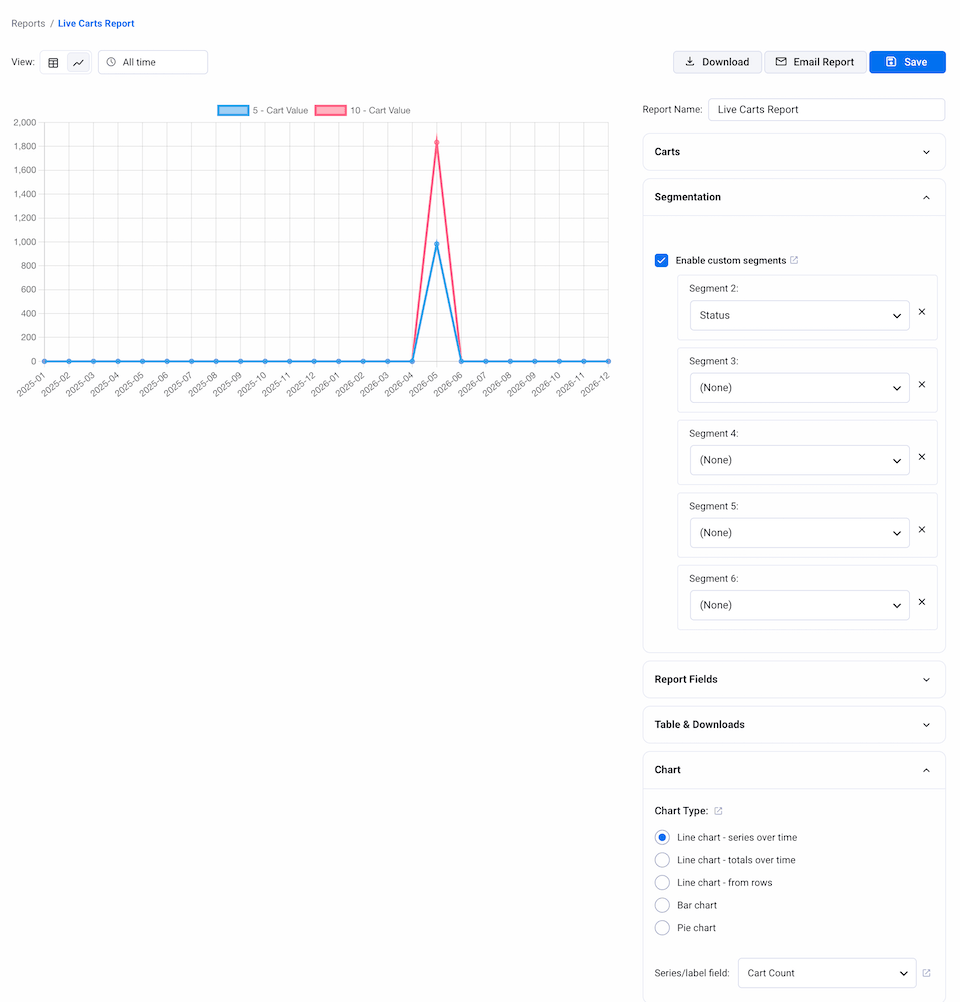
Cart Value (aka Basket Size)
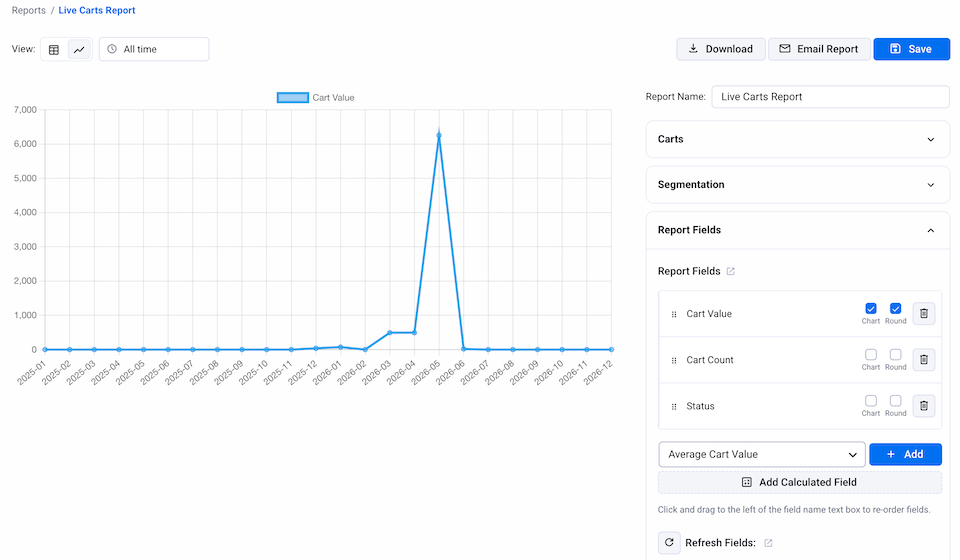
The default Live Carts report in Ninjalytics tracks total cart value over time. This gives you a picture of how your store’s overall shopper activity is growing or declining over time.
In the Report Fields section, you can also chart the Average Cart Value. If this number increases over time, your cross-sells and upsells are likely working. If it flattens out or declines, it’s worth investigating.
Filtering by Product or Category
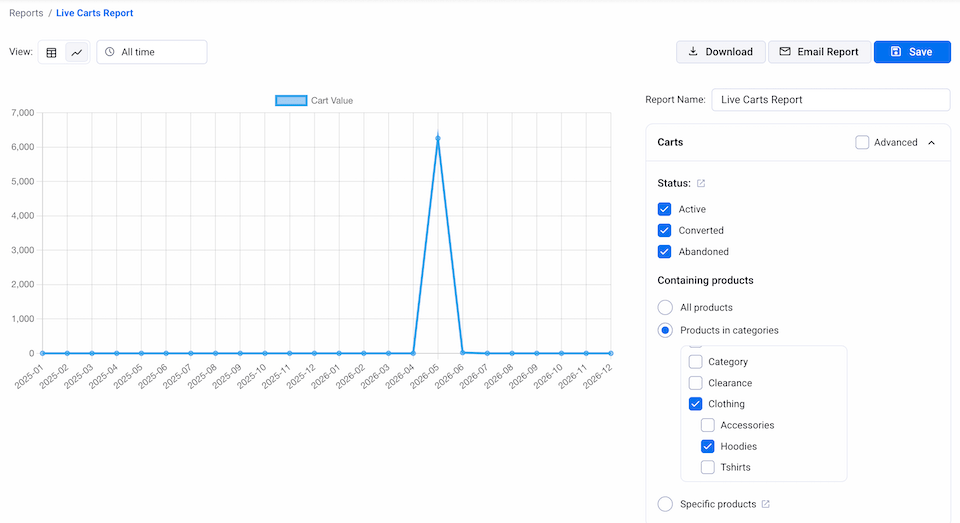
You can track metrics, such as total cart value, average value, count, and status, filtering them by product or category. This allows you to focus on a specific slice of your catalog to see how it’s performing in customer carts.
In the Carts panel, select either Products in categories or Specific products to isolate carts containing individual items. Run the same conversion or value reports as before, but now limited to that specific segment. This is useful for understanding which parts of your catalog need more attention and where customers are likely to drop off.
Digging Deeper: Exporting Cart Data
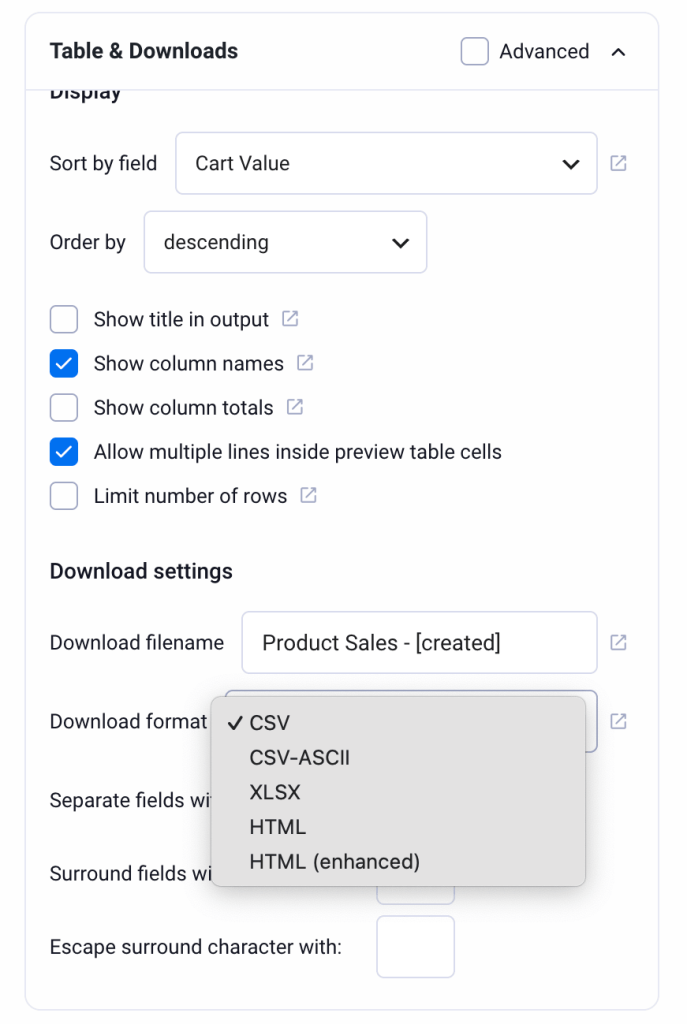
Sometimes you want to go beyond charts. Ninjalytics includes export functionality for Live Carts data, allowing you to view or download details of individual carts, including their full contents in table format.
Use the Table & Downloads panel to access this. From there, export as a CSV, XLSX, or HTML, and take your analysis further in your favorite spreadsheet software.
Before You Get Started
It’s worth noting that Live Carts only captures carts that are active on the site after the plugin is installed and activated. It can’t go back and show you historical data from before it was added to your site. The sooner you install it, the sooner your data starts building up.
Install Live Carts first to start collecting cart data. Then get Ninjalytics to report on it.
Want More?
The free versions of both plugins cover everything mentioned in this post. If you need more, both have Pro tiers that are worth exploring.
- Live Carts Pro: Adds cart editing, recovery URLs, one-click order creation, advanced filters, and automated recovery emails (coming soon). Learn more about Live Carts Pro.
- Ninjalytics Pro: Adds additional export formats, pie chart support, a mobile app for reports on the go. Available for Android, with iOS in beta. Learn more about Ninjalytics Pro.
Start Tracking Today
If you’re not tracking cart metrics yet, it’s time to get started. Every day without Live Carts running is another day of data you can’t get back.
Download Live Carts for WooCommerce free
Working with WooCommerce and want to stay up to date? Join the BerryPress community on Facebook to share ideas or subscribe to the newsletter for plugin updates and new tutorials straight to your inbox.