Ninjalytics
CHOOSE A PLAN
Free
- Access to free features
- Access to product updates and improvements
- Standard support
Single Site
- Access to all premium features
- Use on 1 website
- 1 year of updates
- 1 year customer support
- Priority support
- Cancel subscription anytime
Unlimited Sites
- Access to all premium features
- Use on unlimited websites
- 1 year of updates
- 1 year customer support
- Priority support
- Cancel subscription anytime
Actionable Insights at Your Fingertips
To have a successful online store, you need quick access to accurate data. Discovering what’s making you money and what’s costing you money will help you engineer your eCommerce business to maximize profits. Enter Ninjalytics!
With the intuitive, flexible and powerful Ninjalytics platform, you can create eCommerce data reports quickly and easily. From data retrieval to processing and visualization, access all of the platform features and build powerful reports straight from your WordPress ecommerce website. Sell more, spend less and start turning bigger profits. Use data driven strategies to build your eCommerce empire.
Ninjalytics works with WooCommerce and Easy Digital Downloads!
Visualize with Charts
See trends, ratios, and comparisons more easily with line, bar, and pie charts.
Custom Calculated Fields
Define formulas for calculated fields, without using spreadsheet software.
Product Sales Report Pro Compatible
Seamlessly transition from Product Sales Report Pro with automatic import of reporting presets.
Simplified UI
Avoid being overwhelmed with our new UI that hides less commonly used settings by default.
Live Report Preview
Watch your report update automatically as you change settings.
Multi-Platform Support
Built-in support for both WooCommerce and Easy Digital Downloads.
Custom Segmentation
Aggregate sales metrics by product, country, state, currency, payment method, and many other variables.
Dynamic Date Ranges
Define your report period in one of three different ways to minimize the need to re-enter dates.
XLSX and CSV Output
Output tabular data in various common formats, including XLSX (Excel) and CSV.
Built-in Templates
Skip the configuration and run common reporting scenarios with just a few clicks using our built-in templates.
Safeguard Your Data
Keep your data on your site - reports are run locally in your WordPress installation.
Third-Party Plugin Support
Custom meta fields and taxonomies are recognized automatically, allowing you to report on data from third-party extensions.
Effective data visualization
If you don’t like crunching numbers and struggle to see patterns in raw data, Ninjalytics lets you create visualizations of your data. Select from five available chart modes (plus table view) to highlight the most important information about your business. Understand trends, outliers and patterns easily.
Line Chart
Compare metrics of progression and change over two axes, for example comparing monthly earnings.Bar Chart
View metrics of several assets on an axis, for example, quantities of refunds per product category.Pie Chart
Compare proportions of different data types, for example, ratios of product categories sold.Table
Perfect for assessing and comparing various forms of complex information and numerous data sets.Create reports to fit your business
Want more control over your reports? Start from scratch or use one of our built-in report templates to get going faster. You can also create and save your own presets to quickly reuse custom setups. With powerful tools to group, sort, and filter data by order or product fields – and an intuitive drag-and-drop interface – you can build reports tailored exactly to your store’s needs.
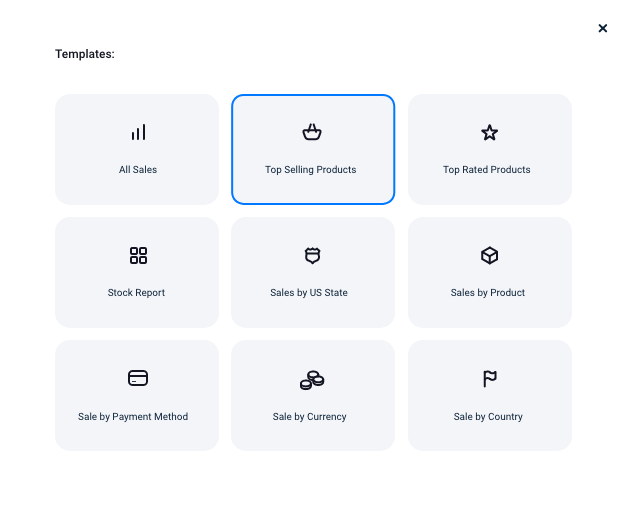
Save time with pre-made report templates
Skip the complicated configuration steps, use one of the included pre-made templates to generate your reports. From product sales reports to order details exports, the templates cover the most common report types so you can get started in seconds. Your reports will be ready before you know it!
View Plans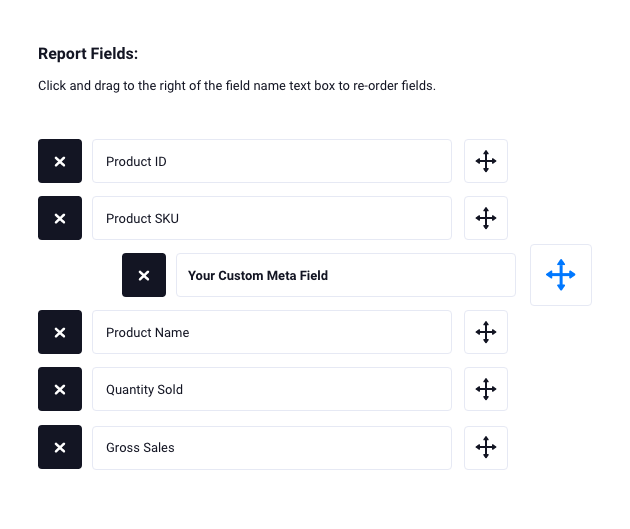
Drag and drop report builder
Setup completely custom reports with drag and drop configuration. Choose what fields you want to be included in your exported order report. Add, reposition, change field titles, and use toggle controls for quickly including or excluding specific fields.
View Plans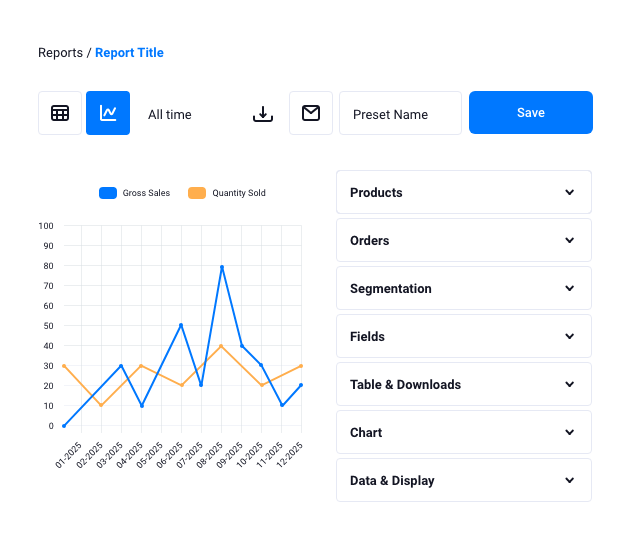
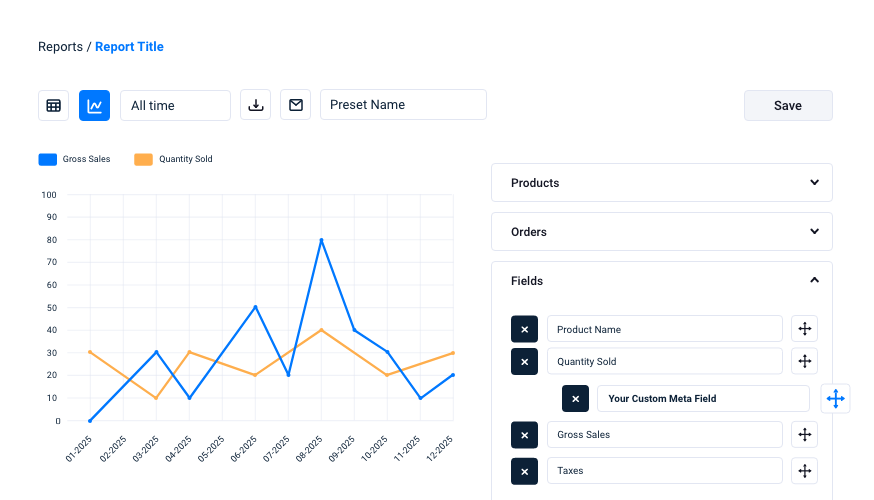
Live report preview
See your report come to life as you build it. On the left, get a real-time preview in the form of a table or chart – so you always know what you’re working with. On the right, fine-tune your setup using a simple panel where you can choose what data to include, how to sort and group it, and what chart type fits best. No complicated steps, just a clear and intuitive way to shape your insights as you go.
View Plans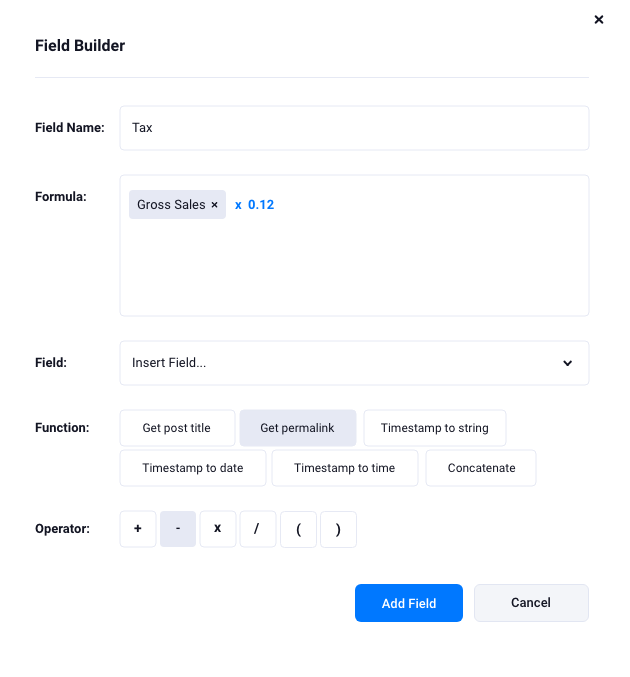
Calculated fields
The Field Builder feature allows users to create custom fields by combining existing data fields, mathematical operations, and custom formulas. This functionality is highly flexible and enables tailored reports that meet specific business needs.
Use basic operations to create custom calculations, for example:
- addition (+),
- subtraction (-),
- multiplication (*),
- and division (/)
Work with various data points and metrics
Understand your product sales, customers, and inventory without requiring specialist or technical knowledge. With Ninjalytics, you can generate reports based on various data points and metrics, then use several filters and grouping and sorting options to extract valuable information about your online store.
| Metrics |
…And More! |
| Filters |
…And More! |
| Grouping by Fields |
…And More! |
Each condition supports flexible comparison logic. Use different methods to check if a product meets your defined rule criteria.
Only logged in customers who have purchased this product may leave a review.
Log inComparison: Free vs Pro
The Free version gives you essential automation tools.
The Pro version unlocks more advanced logic and full control over your product organization.
| Feature | Pro Version | Free Version |
|---|---|---|
| Visualize report data as a line or bar chart | Included | Included |
| Export report data in CSV format | Included | Included |
| Kick-start report creation with built-in templates | Included | Included |
| Save multiple report configurations for future use | Included | Included |
| Specify report date ranges in relative or absolute terms | Included | Included |
| Choose from predefined report fields | Included | Included |
| Report on individual product variations | Included | Included |
| Filter products by category or ID | Included | Included |
| Report on taxes | Included | Included |
| Include shipping in reports | Included | Included |
| Deduct line-item refunds from reports | Included | Included |
| Segment sales by products or product categories, and/or a custom segment | Included | Included |
| Supports WooCommerce | Included | Included |
| Supports Easy Digital Downloads | Included | Included |
| Visualize report data as a pie chart | Included | Not included |
| Export report data in Excel or HTML format | Included | Not included |
| Specify report date ranges as custom expressions | Included | Not included |
| Add custom report fields (product meta, taxonomies, etc.) | Included | Not included |
| Define custom calculated fields based on your formulas | Included | Not included |
| Customize field names | Included | Not included |
| Filter products by tag and/or meta field | Included | Not included |
| Filter sales by order or order item meta field | Included | Not included |
| Filter sales by shipping method | Included | Not included |
| Filter sales by customer meta field or user role | Included | Not included |
| Add up to 4 additional custom segments | Included | Not included |
| View Plans | Download Free |
Frequently Asked Questions
How do I install the plugin?
Does it work with my theme?
Resources & Support
Tags
WooCommerce, Easy Digital Downloads, EDD, Woo, ecommerce, e-commerce, sales report, reports, reporting, analytics, statistics, metrics, export, products
Reviews
There are no reviews yet.